

Strong fundamentals mask rising geopolitical risk
Review the latest Weekly Headings by CIO Larry Adam.
Key takeaways:
- With the Strategic Petroleum Reserve down 25% since February, the oil market’s supply cushion is fading
- Markets are pricing in Fed tightening, though we still expect it to hold steady
- Once oil begins to cool again, it’s likely to pressure energy stocks, while giving a boost to industrials and consumer discretionary
With the US-Iran conflict nearing the five-month mark, equity markets have mostly shrugged off the latest escalation. On one hand, that’s understandable – a healthy economy and record corporate profits continue to support the market’s fundamentals. But a note of caution is warranted.
Investors may be underestimating the magnitude of risks created by the conflict's resurgence. With oil supplies disrupted, gasoline prices are back above $4.00 per gallon, and other key commodities are facing pressure as well. While outright shortages remain unlikely in the US and other developed economies, higher input costs could add to inflation pressures, frustrating consumers and complicating the Federal Reserve's (Fed) job. For companies with significant commodity input exposure, margin pressures may also emerge.
Below, we examine the effects on consumers, the Fed and corporate earnings.
Oil inventories are shrinking and other commodities are also disrupted
West Texas Intermediate (WTI) oil has been on a rollercoaster, surging from $68 per barrel (Feb. 28 – start of conflict) to its recent peak of $113 (April 27), falling to $69 (July 6 – Memorandum of Understanding agreement), and then rebounding to $90 today.
As a result, the national average gasoline price rose back above the psychologically important $4.00 per gallon mark this week for the first time since mid-June. Markets are responding to renewed supply concerns, with oil flows through the Strait of Hormuz once again near a standstill and new Houthi attacks in the Red Sea targeting oil tankers.
Meanwhile, US commercial petroleum inventories have fallen by 46 million barrels (4%) since February, while the Strategic Petroleum Reserve (SPR) has declined by 104 million barrels (25%) to its lowest level since 1983. Compared to the conflict's initial phase, the supply cushion is much thinner, increasing the risk that demand destruction and broader economic pain play a larger role in rebalancing the market.
Beyond oil, disruptions in the Middle East are affecting several other economically important commodities, including liquefied natural gas, helium, aluminum, and fertilizer, while Ukraine's drone strikes have forced Russia to halt gasoline and diesel exports and have curtailed agricultural shipments. That said, our base case remains a renewed US-Iran ceasefire by mid-August, which would support a pullback in WTI toward $70 by year-end and have little impact on our broader economic outlook.
Rising fuel prices add another strain on consumers
Speaking of “cushions,” during 1H26 consumers benefited from larger tax refunds and moderate interest rates that helped offset the initial jump in fuel prices. Those tailwinds have now faded. The longer gasoline prices remain elevated, the greater the risk to discretionary spending, particularly for lower-income households. And fuel isn't the only affordability challenge. A key food price index is near a four-year high, housing affordability remains strained by elevated mortgage rates (average 30-year mortgage rate is 6.85% – a 12-month high), and healthcare costs continue to outpace inflation.
Amid inflationary pressures, the Fed faces a dilemma
Warsh has made clear in his first weeks as Fed chair that returning inflation to the 2% target is a top priority. While inflation showed signs of cooling in June, the latest surge in fuel prices has complicated the outlook. The policy-sensitive 2-year Treasury yield recently climbed to 4.36%, its highest level since February 2025 and up 98 basis points (bps) since the conflict began.
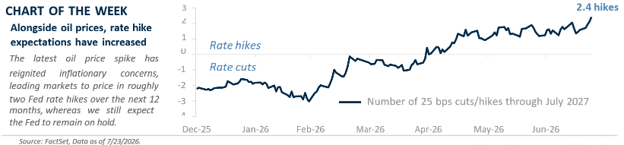
Ahead of next week's Federal Open Market Committee (FOMC) meeting (July 28-29), market-implied odds of a rate hike have risen from ~10% to ~35% over the past week, with investors pricing in roughly two hikes over the next 12 months. We disagree. Our base case remains that the Fed stays on hold through mid-2027, with the next move being a rate cut in the second half of 2027. Supporting that view, long-term inflation expectations have remained well anchored. However, the longer oil prices stay elevated, the greater the upside risk to inflation and, in turn, the Fed's policy path.
Corporate America can manage around high oil prices, up to a point
Despite higher oil prices and yields, investors have largely ignored these headwinds, with the S&P 500 up ~9% year to date and just ~2.5% below its June record high. Much of that resilience reflects strong fundamentals, as early 2Q26 results point to earnings per share growth of 37% year over year, with 85% of S&P 500 companies beating estimates.
But if elevated oil prices begin to erode margins or weigh on economic activity, earnings could be pressured. Beneath the surface, performance has been far less uniform. The energy sector is up ~13% month to date, while consumer discretionary (-7%) and parts of industrials – such as energy intensive industries like airlines (-13%) – have lagged.
Once a diplomatic off-ramp emerges, we expect oil to cool and these trends to reverse. That supports our positive view on consumer discretionary and industrials, while remaining underweight energy. Volatility may persist amid conflict-related headlines, but we expect a favorable fundamental backdrop to lift the S&P 500 to 8,200 over the next 12 months.
Bottom line
The widening Iran conflict, including renewed threats to Red Sea shipping, in parallel with the ongoing Russia/Ukraine war, is raising geopolitical risks. Alongside oil prices surging 38% since the Iran conflict first began, the 10-year Treasury yield has climbed to 4.70%, up ~74 bps. While we continue to believe the US and Iran are incentivized to reach a resolution within the next month, we are not complacent.
We'll be closely monitoring real-time indicators and corporate commentary this earnings season for signs that higher energy costs and interest rates are affecting consumer behavior, economic activity or the market outlook.
All expressions of opinion reflect the judgment of the author(s) and the Investment Strategy Committee and are subject to change. This information should not be construed as a recommendation. The foregoing content is subject to change at any time without notice. Content provided herein is for informational purposes only. There is no guarantee that these statements, opinions or forecasts provided herein will prove to be correct. Past performance is not a guarantee of future results. Indices and peer groups are not available for direct investment. Any investor who attempts to mimic the performance of an index or peer group would incur fees and expenses that would reduce returns. No investment strategy can guarantee success.
Economic and market conditions are subject to change. Investing involves risks including the possible loss of capital.
The information has been obtained from sources considered to be reliable, but we do not guarantee that the foregoing material is accurate or complete. Diversification and asset allocation do not ensure a profit or protect against a loss.
The S&P 500 Total Return Index: The index is widely regarded as the best single gauge of large-cap U.S. equities. There is over USD 7.8 trillion benchmarked to the index, with index assets comprising approximately USD 2.2 trillion of this total. The index includes 500 leading companies and captures approximately 80% coverage of available market capitalization.
Sector investments are companies focused on a specific economic sector and are presented here for illustrative purposes only. Sectors, including technology, are subject to varying levels of competition, economic sensitivity, and political and regulatory risks. Investing in any individual sector involves limited diversification.
